Tutorial
The Sales and or Marketing Departments are responsible for doing the marketing research.
Marketing research consists of secondary and primary research.
Secondary research is done using the Internet, books, magazines, etc. to get some general information about the market.
Primary research is done using a survey of our potential customers and measuring the outcomes.
The aim of primary market research is to gather information from a sample of a market in order to be able to predict what the whole market wants.
Marketing research can be divided into two types:Quantitative and Qualitative.
Quantitative marketing research is about measuring things, like market share, how many people saw our advertising, how many would buy our product at a particulae price, where we should run our advertisements, where our business should be located, how it should be promoted, etc.
Qualitative marketing research is about softer issues, like why people might buy or product, why they think the way they do, etc,
We will explore quantitative marketing research in this tutorial.
Quantitative research is about getting people to answer fixed questions in a survey. We will put our survey on the Internet and they will answer the questions and then submit the answer to the questions to us at our company's email address.
Sample size will be determined using statistical techniques.
A random sample will be taken of the sample population to determine which records to examine.
Random sample means that any one in the population has a equal chance of being included in the sample.
Students will examine a file of the random samples
A computer program will be used to analyze the data in terms of the target market and marketing mix.
Reports will be written to determine the feasibility of going ahead with the target market and marketing elements: Product, Place, price, and Promotion.
California Career Technical Education
Marketing Standards
- E-commerce Pathway
- A1.0 Students understand the fundamental concept of e-commerce
- A1.3 Understand the role of the Internet in expanding business options and creating diverse marketplace opportunities.
- A1.4 Analyze information gained thru e-market research to make decisions about marketing goods and services online.
- A1.5 Identify common e-market research activities and the type of information each provides.
- A1.6 Know appropriate methods of product or service delivery in an e-commerce environment.
- A2.0 Students understand the decisions an e-commerce business makes in the development of products and services.
- Understand how e-commerce has affected traditional branding strategies.
- A2.4 Know the techniques used by marketers in an on line environment to position products and services.
- A2.5 Know the procedures involved in product planning for an on line business.
- A3.0 Students understand important promotional strategies for communicating information about products, services, images, and ideas in an e-commerce environment.
- A4.0 Students understand the purpose, process and components of effective on line sales and purchasing.
- A4.1 Understand what motivates customers to buy on line.
- A4.4 Understand the methods used to provide Internet customers with product and service knowledge.
- A5.0 Students understand the role of technology as it relates to e-commerce
- Understand the role of e-mail in and e-commerce environment.
- A5.5 Know how various tools used in e-commerce (Database solutions) contribute to Web site effectiviness.
- B1.0 Students understand the basic aspects of entrepreneurship.
- B1.5 Formulate pricing strategies for goods and services for a small business.
- B2.0 Students understand the elements and purpose of a business plan
- B2.2 Conduct market research by using a variety of methods.
- B2.3 Analyze market research to develop a marketing plan.
- B2.5 Analyze a proposed business situation and its potential market.
- B3.0 Students understand how to use technology and electronic media to gain a competetive advantage.
- B3.1 Know how technology and electronic media can be used to manage work flow and provide feedback for operational efficiency.
- B3.3 Understand the software technologies used to make a Web site effective for small business needs.
- B4.0 Students understand effective marketing of small businesses:
- B4.4 Understand how market research is used to develop strategies for marketing products or services in a small business.
- D3.0 Students understand how to access and use marketing information to enhance opportunities and activities.
- D3.3 Research consumers' needs and wants to develop, maintain, and improve a product or service.
Materials to Collect
- VE web site marketing materials
- Data on dog owners, products, prices, where it is sold and how it is promoted.
- What demographics are involved: age group, income, education, marital status, etc.
- Put together an outline of what you find.
- Print out Cathy's Department Template From Janet's Web Site Helpful Forms-Forms, Templates and Letters
- Printout VE Progress Logs from Janet's Web Site Helpful Forms-Forms, Templates and Letters
Teacher's Responsibility
- Fill out the Department Template for each department. -What do you want them to accomplish each week.
- Make a copy of the Department Template for each department manager and give the Department Templates to the CEO.
- CEO gives out Department Template to each department head.
- Department head gives out Progress Logs to each employee and from the Department template and the workflow assigns each employee the tasks for the week.
- Employee accomplishes the work assigned and fills in information on the Progress Log.
- Completed Progress Logs for each employee are given to the department VP at end of week.
- Department heads turn progress logs over to CEO.
- CEO turns over progress logs to teacher.
- Set up a filing cabinet drawer for these materials, so you won't have to go through this process next year.
- Evaluate each day's assignment to see if it is completed. You may need to adjust the amount of time for each week's assignment.
-

|
Step-By-Step Instructions
Sales/Marketing (Marketing Research) Day 1
Secondary Research
Using the materials that you collected, we are going to prepare step-by-step instructions (Department Templates) for this project.
- Time line for the project is approximately nine school days.
- Teacher gives printout of this week's Department Templates and blank project logs, for each employee in Sales/Marketing/Advertising departments. to CEO. CEO gives material to VP of Sales/Marketing/Advertising. VP distributes the workload among department employees. Each employee fills in their own log with assignments given by the VP.
- Do secondary research on the Internet to understand the pet market with the emphasis on dogs and dog ownership.
- Answer the following questions.
- How many dogs are owned in the United States?
- What percent of U.S households own at least one dog?
- Most owners own ____ dog.
- How many own two dogs?
- Are there more male or female dogs?
- What percent are adopted from animal shelters?
- What percent of dogs are neutered?
- What is the average yearly cost for basic food, supplies, medical care and training for a dog?
- How much money is spent on pets in the year 2012?
- How much is spent for food?
- How much is spent for over the counter medicine and supplies?
- How much is spent on vet bills?
- How much is spent on grooming and boarding?
- According to the 2011-2012 American Pet Products Association National Pet Owners Survey, basic annual expenditures for dog owners in dollars are?
- Surgical vet visits?
- Routine Vet visits
- Food?
- Kennel boarding?
- Vitamins?
- Travel expenses?
- Groomer/Grooming Aids?
- Comment on the following trends in the 2011 report
- Pampering them?
- Reducing our pets carbon footprint?
- Going to the Dogs?
- Hotels and Motels - Pets welcome
- Shopping for pet products
- Grooming
- Today's pet foods
- High-tech products
- Programmable feeding devices
- Costumes and clothing
- Travelling in the car
- Personalized items
- Write a paragraph on the health benefits that pets bring to us.
- Turn in your report at the end of the day.
Sales/Marketing (Marketing Research) Day 2
Designing the Survey
- Our company sells high-end, organic, made in the USA dog food, canned and dry, top notch leather leashes and collars, dog beds, dog harnesss for the car, dog toys, dog beds, etc.
- Our products are meant for the discerning, quality-demanding, value-conscious dog lover.
- The purpose of our survey is to find the feasibility of selling dog food, supplies, toys, grooming survices, etc .
- We need some information about potential customers so we can define our target market and design our promotional or marketing mix of Price, Product, Promotion and Place.
- To obtain the demographic information as to age, income, education, etc., we will include questions seeking that information
- We will put those questions at the end of the survey.
- We want the questions to be clearly written so we can derive information like what price should we charge for dry dog food ? ,or how important is it to sell dog toys?
- Each question must be of a multiple choice in nature so we can measure the output.
- Open ended questions are much more difficult to evaluate.
- Our survey will be conducted over the Internet.
- We will purchase advertising space from search engines like Google, Bing, Yahoo.
- When customers click on our Internet ad, they will be asked if they want to participate in our survey.
- We can offer an incentive, such as cents off or coupons on products that they purchase with us, discounts on dog spas, grooming, etc
- When the customer is finished with the survey, they will click the submit button and the information will be sent to our company's email account.
- Let's look at the survey. Remember each question that the customer answers should give us information as to how best and who to market our products to.
Designer Dog Survey
- We need to explain to the person taking the survey, the purpose of our survey in the beginning of the text.
- A great deal of thought must go into the design of the questionnaire.
- Does the question tells us what we need to know about how best to market our product line?
- The survey you are looking at centers around the 4P's in marketing theory. Product, Price, Promotion and Place.
- Before determining anything, we must first establish that the person answering the survey qualifies as a buyer. Does he or she own a pet? Do they own a dog?
- If they are not dog owners, we are not interested in their responses to our survey, since they do not qualify as a customer at this time.
- That is the purpose of questions one and two.
- Another item that is a qualifying question, is determined by how they answer question 3. If they do not have access to a device with Internet access they will not be able to buy our products online.
- Of course, if they do not have Internet accessibility, they cannot answer the questionnaire, since if is an on-line survey.
- The questionnaire was designed to find information about the following things listed below.
- Place Questions 4, 5, 6, 12, 14, 18 19, 20
- Product Questions 8, 9, 10, 13, 16, 17, 30
- Price Questions 7, 26, 27, 28, 29, 31
- Promotion Questions 15, 21, 22, 23. 24. 25
- Demographic Questions 11, 32, 33, 34, 35, 36, 37, 38
- Comments box - for respondent to add something they believe that we should know,
- After designing the questions for the survey, we need to give the respondent a choice as how to answer each question.
- For yes and no or true false questions we use radio buttons to collect information. Only one button can be clicked at a time. If you click the other, the previous one is clicked off.
- The answers offered are determined by the researcher. Incomes for example, are from the IRS tax brackets. Education levels is pretty straight forward, along with ethnicity, marital status and age.
- Questions like number 9 go from loving the idea to hating it. The format is that of a Likert scale
- Other responses given to the respondent on the questionnaire are obtained from your secondary research and show how much you know about the market you are about to compete in.
- Your assignment is to :
- Take the questionnaire for yourself, feel free. The answers go to my email account.
- Come up with a list of two questions each for product, place, price and promotion.
- Come up with at least two additional demographic questions and their responses.
- Turn these questions and responses available in to your department manager at the end of the day.
- Printout the survey you completed.
Sales/Marketing (Determining Sample Size) Day 3
- Our dilemma today in doing the survey involves, how many people do we need to ask to complete our survey and have the results representative of the entire population of dog owners?
- It would be impractical and costly to ask all dog owners
- The answer to that question is influenced by a number of factors, including the purpose of our study, the population size of dog owners, and the risk of getting an unrepresentative sample.
- We also need to account for sampling error.
- In addition to the above factors, we need to consider three criteria to determine the appropriate sample size.
- Level of precision - sampling error is the range in which the true value of the population is estimated to be. This is often expressed as a percentage. For example, ± 5 percent in a survey of who should be president. If our findings are that one candidate is favored by 70% of the voters, then we can assume that between 65% and 75% are in favor of that candidate.
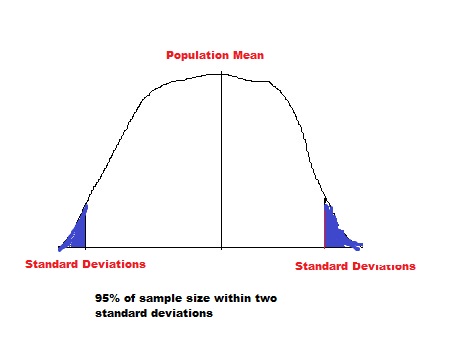
- Level of confidence or risk. When a population is repeatedly sampled, the average value of the attribute obtained by those samples is equal to the true population value. The values are distributed normally about the true value, called the mean. Some will have a higher value and some results will have a lower value, In a normal population, 95% of of the survey values are within two standard deviations of the mean. This means that if a 95% confidence interval is chosen, thet 95 out of 100 samples will have the true population value. You can increase the validity of your study by increasing the confidence level to 99% or lowering it to 90%.
- The degree of variability in the attributes or concepts being measured, refers to the distribution of attributes in the population. The more hetergenoous a population, the larger the sample size is required to obtain a given precision. The more homogenous a population is, a smaller sample can be taken. A proportion of .5 indicates the maximum variability if a population. It is often used in determining a more conservative sample.
- To come with an estimate of variability, simply take a reasonable guess of the size of smaller concept you're trying to measure. For example if you estimate that 30% of the population buys their dog food at a pet store and 70% does not then your variable would be 30%
- If degree of variability is too difficult to determine, use 50% as the degree of variability. This is a conservative approach.
- There a number of ways for determining sample size:
Using an actual census - looking at all members in a population
- Use a sample size of a similar study
- There are published tables that tell you what sample size to use based on confidence level and precision levels.
- You can use a number of formulas to determine sample size.
- Our study is attempting to decide how many people will buy our dog products, how much will they spend on their dog, where do they shop for dog supplies, etc.
- For our study we will use the formula approach. The variables in the formula are included in the sample size calculator.
Sample Size Calculator
- Using the sample size calculator, solve the sample size questions. Turn in to your instructor.
1. Confidence level = 90%, Level of precision = ±5%, degree of variability = 20%
2. Confidence level = 90%, Level of precision = ±4%, degree of variability = 30%
3. Confidence level = 90%, Level of precision = ±5%, degree of variability = 40%
4. Confidence level = 90%, Level of precision = ±5%, degree of variability = 50%
5. Confidence level = 90%, Level of precision = ±4%, degree of variability = 50%
6. Confidence level = 95%, Level of precision = ±5%, degree of variability = 20%
7. Confidence level = 95%, Level of precision = ±4%, degree of variability = 30%
8. Confidence level = 95%, Level of precision = ±5%, degree of variability = 40%
9. Confidence level = 95%, Level of precision = ±5%, degree of variability = 50%
10. Confidence level = 95%, Level of precision = ±4%, degree of variability = 50%
11. Confidence level = 99%, Level of precision = ±5%, degree of variability = 20%
12. Confidence level = 99%, Level of precision = ±4%, degree of variability = 30%
13. Confidence level = 99%, Level of precision = ±5%, degree of variability = 40%
14. Confidence level = 99%, Level of precision = ±5%, degree of variability = 50%
15. Confidence level = 99%, Level of precision = ±4%, degree of variability = 50%
Sales/Marketing (Probability) Day 4
- Probability is will a specific event occur and how certain are we that the event will occur.
- The certainty that we adopt can be described in a numerical measure and the number is located between 0 and 1. Zero occurrences means no chance and 1 means every time.
- For example, the probability of flipping a coin and getting heads is 50%. We assume that after flipping the coin 100 times, that in the long run, we will get 50 heads and 50 tails.
- The more times we flip the coin the better chance we have of getting that probability.
- Use the Coin Toss Program to answer the following questions.
- Flip the coin 5 times. How many heads? How many tails?
- Press Back button on browser. Click coin toss link again to reload the program
- Flip the coin until heads and tails are equal. What is this number?
- Press Back button on browser. Click coin toss link again to reload the program
- Click the toss button 100 times. What are the percentage of heads? and percentage tails tails?
- Turn in your answers to your instructor.
- Probability theory is applied in everyday life in risk assessment reliability.
- The lottery relies on probability theory. Lottery officials calculate the probability of one person getting all the numbers right. The odds are stacked in favor of the lottery folks and your chances of winning millions of dollars is very slim.
Slot machines are calibrated using probability theory. Casinos want to have just a few big pay outs and take in much more money than they ever pay out.
- We will use probability in the next day's assignment as it relates to random numbers. Any particular number has and equal chance of being chosen.
- We will use random number assignment to determine which of our survey to examine to determine target market and marketing mix elements.
1
Sales/Marketing (Random Sample) Day 5
- A simple random sample is similar to putting the names of all students in your school in a hat, and then drawing 300 names.
- A more scientific approach is to use the computer to select these students from the list of all students.
- There many companies that will sell targeted mailing lists of dog owners and lists for many other categories.
- We could have the list include all dog owners in the United States, or California
- These lists would be huge and costly to sample.
- If we take a county that we believe is representative of the whole country, then we can expedite the process and reduce the cost.
- Some companies even update these lists on a regular basis.
- In Santa Barbara County, for example, there are 88,410 people
- There are 2.5 persons per household
- If we divide the population by 2.5 we get 35,364 households.
- 63.2% of households in Santa Barbara County own a dog.
- Next multiply we by .632. We get 22,350 households with dogs in Santa Barbara County.
- These are the people we are interested in interviewing or including in our survey.
- To get a list of these people, new start-up companies would be wise to get a list containing these individuals.
- We want to take a random of sample of these 22,350 dog owners that represent this population
- The response rate to your survey is dependent on a number of factors
- How long the survey is.
- Respondents should be able to quickly answer the questions and the survey should not take more than ten or fifteen minutes to complete
- if you promise the respondents a copy of the results, that will increase response rate.
- Brand loyalty and brand recognition influence response rates.
- One of the biggest reasons to answer an on-line survey is the compensation received.
- What are you going to give them as an incentive if they complete the survey?
- Follow up e-mails encouraging the respondent to complete the survey are also effective in increasing response rate.
- It has been shown that such follow up letters increase participation 25%.
- You as the market research person, should draft an e-mail asking respondents to go to the web site listed in the email and answer the survey.
- Remember, include some pictures, your logo, contact information and the URL of the web site where the survey resides,
- Turn the e-mail into your department head at the end of the day.
- Normal response rates to on-line surveys depend on a number of factors. For this lesson we will assume that we received 45% of the 22,350 surveys or 10,057 responses.
- 45% for a survey of this type is an excellent return rate. Other rates vary from 20% to 30% based on a number of factors listed above.
- Here is what the response looks like for our survey.
- Take out a copy of the actual survey to compare it to the answers
Designer Dog Survey
- As you can see, the question number is included in the response. Q1 means question 1
Our respondent, clicked the "yes" button on question one
- He clicked "no" on question 11 about children living at home.
Result of one returned survey
- Here are the steps to follow to obtain the necessary information.
- Determine sample size. Click on Sample Size link.Sample Size Calculator
- In our case we are want a 95% confidence interval ±5% with 50% odds of people buying our product.
- Once we have found the number in our sample, we need to determine which of these in the population should to be surveyed.
- Click on the Random Number Generator link to get a list of numbers equal to the sample size.
- Random Number Generator Program
- Since we have a 10,057 returned surveys, click on the 10,000 radio button
- Click the Random Number Generator Button, the number of times equals to your random sample number - 271.
- You will notice that each click is kept track of for you.
- Write down these numbers or key them into Excel.
- If you want to key them into Excel and you have Windows 7 Open each application then use the Windows key and right and left arrow to put each application on the desktop with both visible.
- Sort them from low to high.
- Follow these steps to sort using Excel 2007
- Select the random number column.
- Click the data tab.
- Click the sort box.
- From the sort drop-down list, select the column you wish to sort by - The random Number column
- Select the other column - the record number column
- Tell Excel how you want to sort - Lowest to highest
- Click OK
- Print out your list.
- Look for duplicates. There are probably a few. Cross out the duplicate
- Our sample can be a few less than 271.
- When the surveys come in, batch them in piles of 100.
- Cross of the name of the respondent on the list.
- Send a follow-up email to those who have not responded.
- Write the record number and random number on each survey.
- Pull out the 271 of them that have a random number assigned. These are the records we want to use to create a file.
- We will use the marketing research program to make sense out to the data we have collected.
- You are not going to do the previous 9 steps. These lines are for your information only as how to organze the data.
- The 271 surveys are ready for you to work with,
Random Number Generator
Sales/Marketing (Marketing Research Program) Day 6
- Getting The Survey File
- Double click the file name
Survey File.txt
- When it opens in Notepad, Save it to your computer in your documents folder.
- Getting the Marketing Research Program
- How to use the Marketing Research Program.
- Click File on the menu bar.
- Click Open File
- Click on Survey File.txt
- Note the tabs are disabled until you open the file
- Demographics
- Click on the Demographics tab.
- Click the button labeled See Demographics
- There are 271 records in the file. Remember this is our sample size selected from 10,000 responses to the survey
- The purpose of the Marketing Research software is to organize and collate the data into numbers we can work with.
- The file is created by copying and pasting all 271 surveys together into one file. It is not actual data, but data created for the purpose of showing you information about target markets and buying habits.
- We might have hypothesized that our target market was a family with two or three kids, both parents working, in their 30', high school graduates or a couple of years of college, snd making a modest income.
- Of course, this group buys dog and pet products. But does our data substantiate that?
- In theory, we laid out all 10,000 surveys and numbered them when they cam in.
- We next used our sample size program to determine how large our sample needs to be to get accurate results.
- Next we assigned the random numbers to the numbered surveys.
- Next we pulled out the 271 surveys and compiled them all into one file containing all the data from the 271 responses.
- It is from this file that we will make determinations about our target market and promotional mix.
- Analyzing the demographic data
- Answer the following questions. Turn in your work to your department head.
- What is the breakdown in gender in our survey: Males Females
- Under marital status, which group of respondents has the highest number? What is the percentage?
- Which ethnic background is most represented in our sample?
- How many Black respondents to our survey were there? _____%
- What percentage was Hispanic?
- What percentage of Asians were in the survey?
- How many are listed in Native American?
- What can you tell us about the education level of our sample?
- Does the data show us that a lot of children are still living at home?
- Target Market Tab.
- Click on Target Market tab
- Click on Define Target Market button.
- The software picks out the categories with the highest numbers and percentages.
- These individuals define our target market.
- There are nine text boxes on this tab representing the same categories as the demographic section.
- This part of the program summarizes the results.
- The target market text box is a summary of the information contained in the boxes above.
- Describe your target market in terms if gender, marital status, race, education, offspring and incomes.
- Turn in your written paragraph to your department head.
- Market Segment
- Our target market is not entirely homogeneous, meaning there are some differences within our group.
- Gender differs. Are their difference in the buying habits between men and women?
- Click on the Market Segment tab.
- This part of the program works a little differently than the previous parts.
- Here you can have the program search through the file and find matches that align with the radio buttons that you clicked.
- You must click one button in each group for the program to work.
- The software searches, for example, all single, Asian, teenage females
- Let's search for White teenage boys that are single.
- After selecting the buttons, click the Search button.
- How many are in the group outlined above? Percentage?
- What are their record numbers?
- When the program finds a match to records in the file, a message box pops up and the record number is revealed.
- You can then use the all records tab to view those records for additional information about the respondent.
- Write down the numbers to use them later to get more information.
- Click OK to continue.
- Now let's examine other segments of our target market.
- Select Female, married, aged 46-60, White.
- Click the Search button.
- How many records match this description?
- What percent is this of our sample?
- Write down the record numbers that match the above criteria.
- Click on the All Records tab to see a list of all the records.
- Scroll down to the first record. Number 19.
- Let's see if there is a correlation between this group and whether any children live in the household and what their incomes are.
- I suppose you could image that a married woman aged 46-60's, kids would be not living in the her household.
- Investigate this trend, education and household income in a majority of the records that matched the criteria.
- What did you find?
- I suppose that race probably does not matter, but let's see.
- How many married Black females aged 46-60 are in our sample? Percentage?
- How many married Hispanic females aged 46-60 are in our sample? Percentage?
- How many married Asian females aged 46-60 are in our sample? Percentage?
- How many married Native American females aged 46-60 are in our sample? Percentage?
- What is the total of all females, all races, aged 46-60 married? Percentage?
- Now check out the males all races. How many total all races, married, males, are aged 46-60?
- If we add males and females, married, 46-60, all races. What percentage of the total is our target market?
Sales/Marketing (The 4P's) Day 7
- Today we will look at the Product tab, Place tab, Price tab, and Promotion tab.
- The program is matched to the survey. Each question in the survey has a corresponding result in the Marketing Research software.
- For example, question 8 in the survey asks which item have you purchased in the last six months.
- The respondent can choose between: dog toys, dog leashes, dog collars or dog beds.
- The first item on the Product tab addresses this question.
- Click on the Product tab
- Click on the See Product Results button and answer the following questions.
Printer Friendly Version - Days 1-8
|